Infographics are everywhere. And it’s no wonder why that’s happening, because infographics put a lot information into a small, engaging space.
With such a configuration and so much usefulness, there’s a lot to be gained by creating and infographic. And, it not only shows creativity, it shows an ability to boil down a plethora of facts, figures and statistics and put them into an organized list which can also be used to compare and contrast.
The trick is making an impression–and that isn’t an easy feat because you’re goal is to make a visual impact and strike a mental chord. In order to accomplish this, you’ll have to put your best foot forward, pleasing both sides of the human brain. Now, it sounds like a much larger task than it did when you first began thinking about putting together an infographic. But that’s okay, there’s plenty of good information right here.
Good Versus Bad Infographics
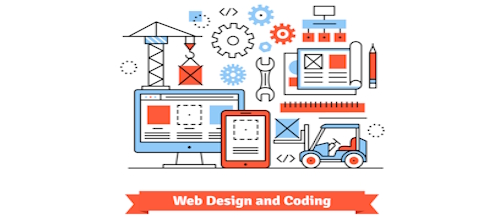
Okay, you’ve seen plenty of examples of infographics on all kinds of sites across the web. And you’ve been eyeing some free or low cost infographics software that will do the job nicely, so you think. If only it were really that simple: download a piece of software, plug in some text and numbers and watch your infographics come alive.
Infographic spam. It’s everywhere, clogging up the Web like kudzu, warping Google page-rank algorithms to boost the profiles of websites that pretend to be providing a public service, but are actually bottom-feeding scum-suckers. Maybe it’s no surprise that part-time, amateur bloggers fall for the scam with regularity, but you can also find these infographic Trojan horses at name-brand media outlets. —Salon.com
It might surprise you to learn, it isn’t anywhere near that simple. Sure, there’s all kinds of software and web-based applications available but those are severely limited in their scope. The word “customization” only goes so far. You’ll quickly discover that what these programs do is somehow pound a square peg into a round hole. Not surprisingly, it doesn’t end there, you may have downloaded malware to your machine in your zeal to get something out.
To really get what you’re looking for, you’ll have to spend a good deal of time and money to get the right software, then conceptualize your design, create your design, add all the necessary elements and then publish it.

Designing Infographics that Get Shared
 Now that you know what not to do, here’s a checklist of how to design infographics which look great and pack a lot of factual punch:
- Focus on the end user from start to finish. Now that sound obvious, but it’s all too easy to get lost int he minutia of design, loosing sight of the end goal. And the end goal is to make a eye-catching, informative graphic that actually has a point. Keep the end user in mind every step of the way.
- Show, don’t tell. The purpose of infographics is to tell a story with pictures. Let’s reiterate that: tell a story with pictures. In other words, you don’t have the space to explain everything. Keep your wording tight and to the point with facts and figures.
- Don’t use typography as a crutch. Where you’ll sabotage your own effort is to use fancy typography rather than compelling facts. Think of it as you would the adage about putting lipstick on a pig. No matter how visually impressive it looks, if it doesn’t mean anything, it won’t get shared, period.
- K.I.S.S. or, well, you know. Keep it simple, stupid–you’ve heard that with so many things and infographics are no exception. Don’t cramp too much information into each frame. Clutter will only serve as a turn off and defeat the entire purpose of putting the time and energy into the effort.
- Check your facts twice. Things change quickly in this world, especially when dealing with current events, business trends and anything related to the internet. Also, list your sources at the bottom of the graphic for the sake of credibility.
- Use common graphics. Now’s not the time to introduce Dali-inspired charts. Use things which are familiar, like pie and bar charts. This not only makes it easier to read, but doesn’t introduce big time distractions.
- Test your design and revamp as necessary. Don’t rush it out, run it by a test audience first. The point to this exercise is to see the forest for the trees. You might have missed something crucial or made a faux pas.
If you want to create a high quality infographic or a series of them, contact us. We can design infographics that send a clear message and get shared across social media. We can also make some suggestions on how to improve your site design and make it optimized for higher organic search ranking.